Unified Observability Platform
Metrics, logs, and traces.
One platform. No glue.
Metrics, logs, and traces in a single cloud platform. Built in Rust with Apache Arrow for fast ingest, flexible query paths, and tiered storage.
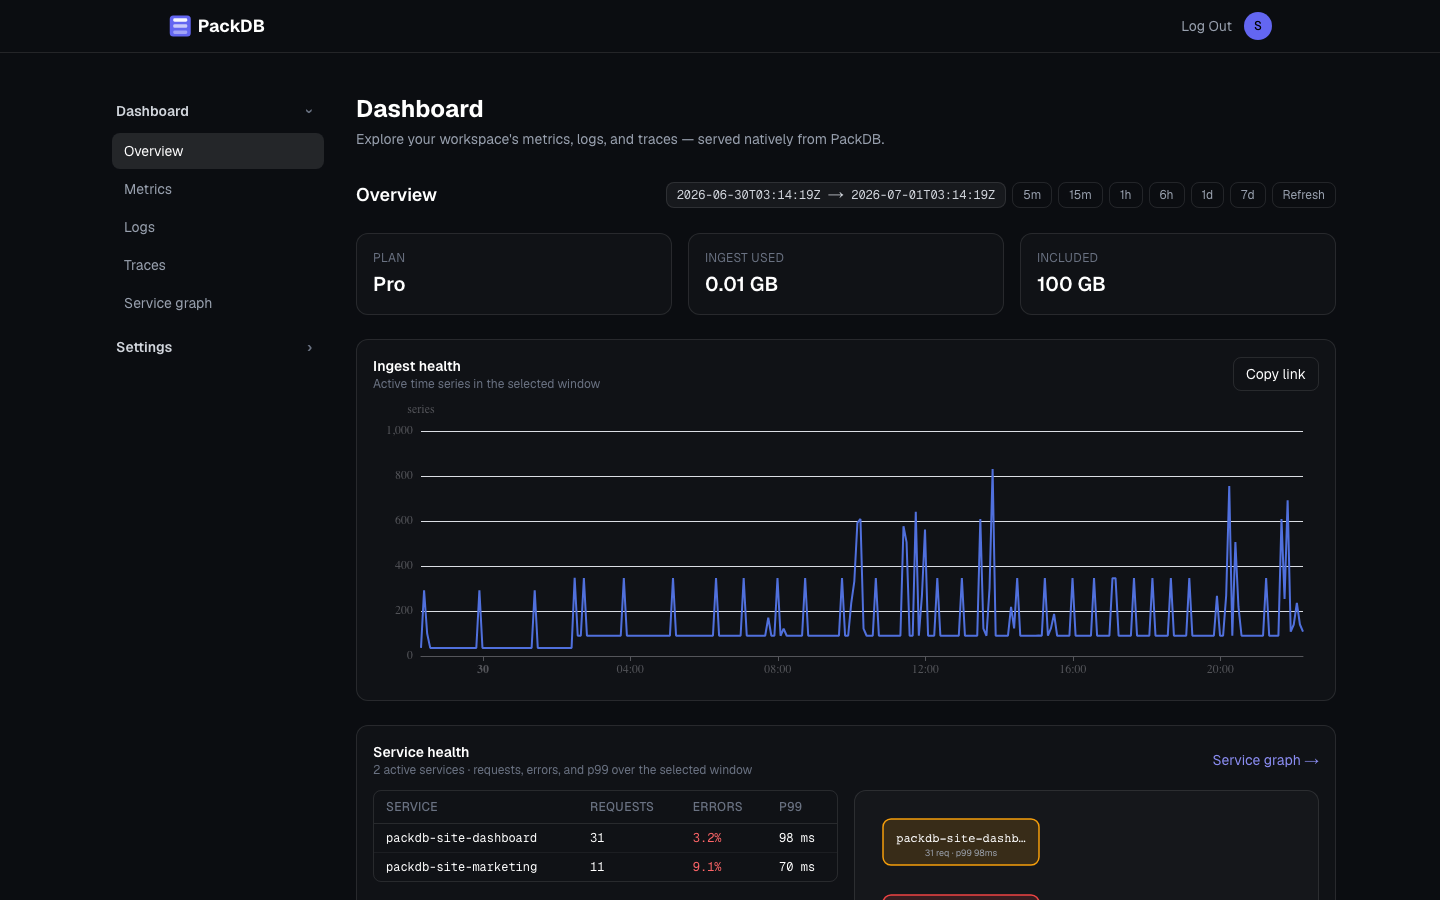
One workflow, no tab-hopping
Follow the whole investigation
Start at the service graph, follow a slow or failing request into its trace, and open the logs that span emitted — with that service's metrics a click away on the same window. All in one platform, without exporting to another tool.
- 1
Service graph
Spot the service that's erroring or slow in the dependency map.
- 2
Trace
Open a representative trace and walk the spans to the culprit.
- 3
Logs & metrics
Open the logs that span emitted, or that service's metrics, on the same window.
- 4
Evidence
Copy a link that reopens the query and window — or the selected trace and span — in the incident.
Bring your own Grafana
Keep Grafana. Add PackDB.
PackDB speaks the Prometheus, Loki, Tempo, and Jaeger query APIs, so existing Grafana can connect through standard datasource types — no plugin, and datasource-backed workflows stay in Grafana.
Prometheus
MetricsPromQL-compatible endpoint; existing Prometheus dashboards import unchanged.
Loki
LogsLogQL-compatible endpoint for log queries and Explore.
Tempo
TracesTraceQL trace search in Grafana Explore, over the same workspace key.
Jaeger
TracesJaeger-compatible trace exploration for existing setups.
Usage-based, no surprises
Costs you can predict
One telemetry bucket across metrics, logs, and traces, then a single flat overage rate — not a separate meter per signal. Enterprise terms stay sales-led.
One included bucket
100 GB/mo
on Pro across every signal; 5 GB on the 90-day free evaluation.
Flat overage
$0.50/GB
beyond your bucket — the same rate for metrics, logs, and traces.
Retention
30 days
on Pro (14-day on Free), across every signal.
Example: 130 GB in a month on Pro = $49 base + 30 GB × $0.50/GB = $64/month. That's the PackDB usage charge before taxes.