All your telemetry.
One platform.
Unified metrics, logs, and traces in a fully managed cloud platform. Built in Rust for speed. OpenTelemetry native. Start with a free evaluation.
Sending data in 2 minutes
Point your OpenTelemetry collector at PackDB. That's it.
# otel-collector-config.yaml
receivers:
  otlp:
    protocols:
      grpc:
      http:

processors:
  batch:

exporters:
  otlphttp/packdb:
    endpoint: "https://ingest.packdb.io"
    headers:
      x-api-key: "<YOUR_PACKDB_API_KEY>"
    compression: gzip

service:
  pipelines:
    metrics:
      receivers: [otlp]
      processors: [batch]
      exporters: [otlphttp/packdb]
    logs:
      receivers: [otlp]
      processors: [batch]
      exporters: [otlphttp/packdb]
    traces:
      receivers: [otlp]
      processors: [batch]
      exporters: [otlphttp/packdb]
Then verify your first telemetry and run your first queries in the quickstart.
The workflows, not the feature list
Every card is something you do in the product today — and links the proof.
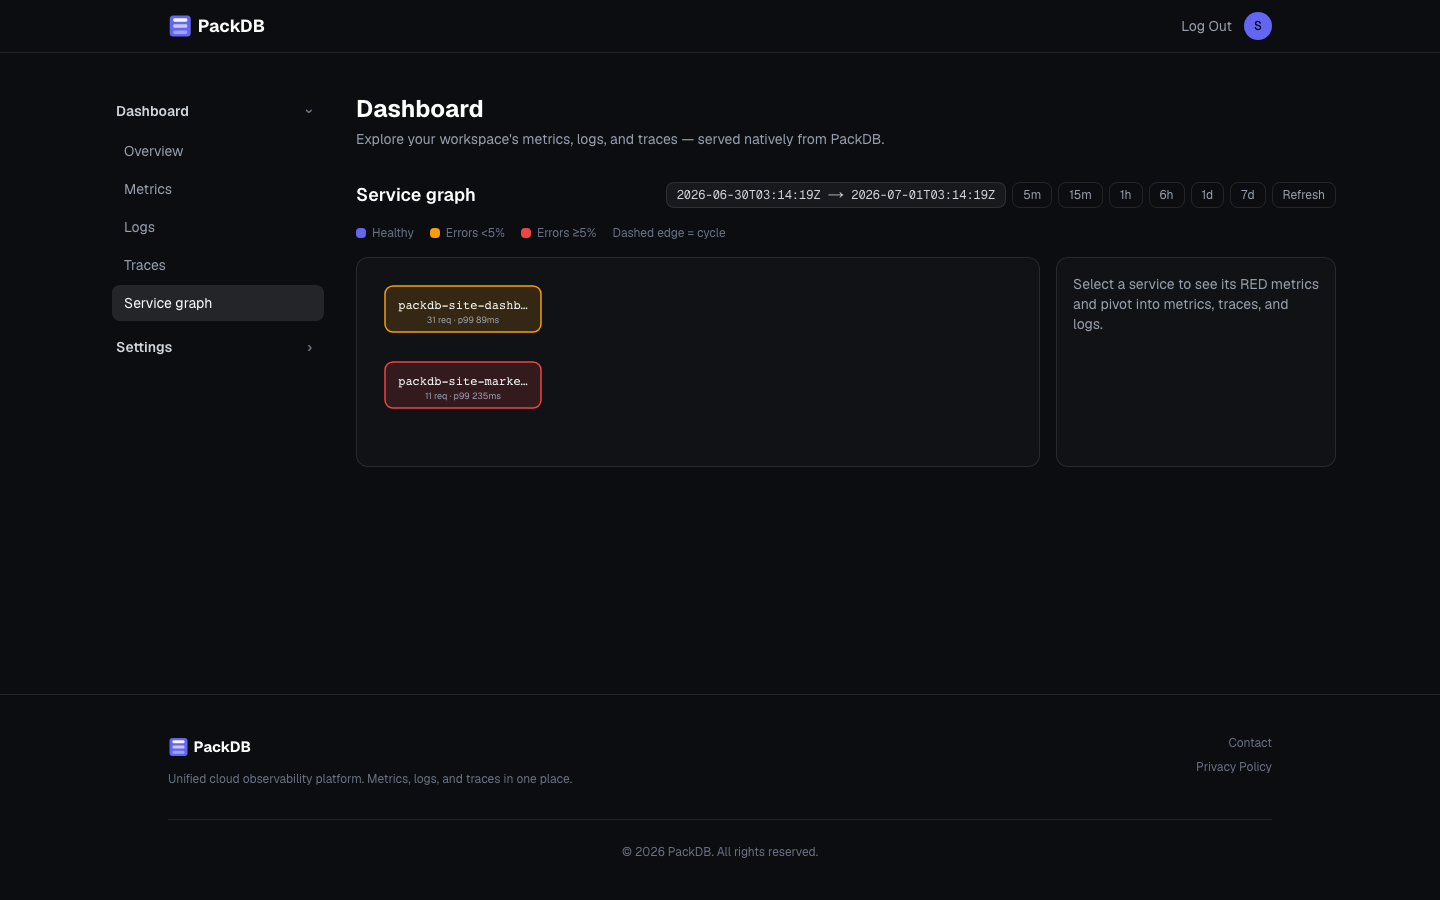
Investigate from the service graph
Spot the erroring service in the dependency map, open a representative trace, and jump from a span straight to the logs it emitted — or to that service's metrics over the same window. One platform, no tab-hopping.
Watch the investigation loopSend data in minutes
Point your OpenTelemetry collector at PackDB with one exporter block, then verify each signal is flowing from the workspace readiness checks.
Follow the quickstartKeep your Grafana dashboards
Provision Prometheus, Loki, Tempo, and Jaeger datasources against PackDB with one API key — existing Prometheus dashboards import unchanged.
Set up the datasourcesQuery in your language
PromQL for metrics, LogQL for logs, TraceQL for traces, and SQL over FlightSQL or REST for cross-signal analytics — plus a Jaeger-compatible API for the tooling you already run.
Browse the docsLink evidence in incidents
Use Copy link in the explorer to preserve the query and time window — or the selected trace and span — behind an incident claim.
See it in the product tourPredict your bill
One included telemetry bucket across all three signals and a single flat overage rate — the whole usage charge fits in one line of arithmetic.
See full pricingWorks with your existing stack
Compatible APIs mean no migration headaches.
Start observing in minutes
90-day evaluation with 5 GB/month included. No credit card required.